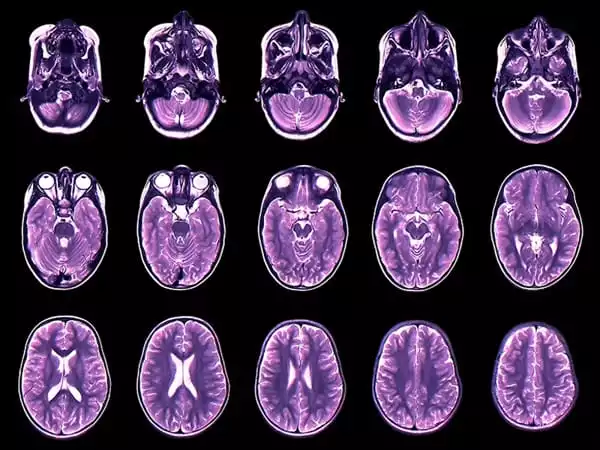
A multinational team of academics has constructed a set of brain charts spanning our whole lifespan – from a 15-week-old fetus to a 100-year-old adult – that demonstrate how our brains expand fast in childhood and gradually diminish as we age.
The charts are the outcome of a six-continent research endeavor that brought together one of the largest MRI datasets ever assembled — about 125,000 brain scans from over a hundred distinct investigations. Although the charts are not yet designed for therapeutic use, the team expects that they will become a common clinical aid in the same way as standardised juvenile growth charts are used.
For almost 200 years, growth charts have been a cornerstone of paediatric healthcare, and they are still widely used in clinics to help track children’s growth and development in relation to their peers. A typical growth chart could depict age on the horizontal axis and height on the vertical axis, but instead of a single line, it will show a range that indicates natural variability in height, weight, or head circumference.
For evaluating age-related changes in the human brain, there are no comparable reference charts. The lack of tools for standardised assessment of brain development and aging is particularly relevant to the study of psychiatric disorders, where the differences between conditions and heterogeneity within them necessitate instruments that can say something meaningful about a single individual in the way clinical reference charts can, and to conditions such as Alzheimer’s disease, which cause brain tissue degeneration and cognitive decline.
Today’s study, published in Nature, is a major step towards filling this gap. Unlike paediatric growth charts, BrainChart — published on the open access site brainchart.io — covers the whole lifespan, from development in the womb through to old age, and aims to create a common language to describe the variability in brain development and maturation.
We’ve been able to stitch together data throughout the entire life span thanks to a really coordinated global effort. It has enabled us to quantify both the very early, quick changes that occur in the brain and the lengthy, sluggish deterioration that occurs as we age.
Dr. Richard Bethlehem
The incredible growing and shrinking brain
The brain charts have enabled researchers to validate – and in some cases, demonstrate for the first time – developmental milestones that were previously only hypothesized, such as when the brain’s major tissue classes reach peak volume and when specific regions of the brain attain maturity.
One of the study’s co-authors, Dr Richard Bethlehem of the University of Cambridge’s Department of Psychiatry, stated: “We’ve been able to stitch together data throughout the entire life span thanks to a really coordinated global effort. It has enabled us to quantify both the very early, quick changes that occur in the brain and the lengthy, sluggish deterioration that occurs as we age.”
Among the key milestones observed by the team were:
- From mid-gestation onward, the volume of grey matter (brain cells) rises fast, culminating just before we reach the age of six. It then gradually decreases.
- The volume of white matter (brain connections) rose fast from mid-gestation to early infancy, peaking shortly before the age of 29.
- After 50 years, the reduction in white matter volume begins to accelerate.
- At 14-and-a-half years old, grey matter volume in the subcortex (which controls physical processes and basic behavior) peaks in adolescence.
Towards a clinically-useful tool
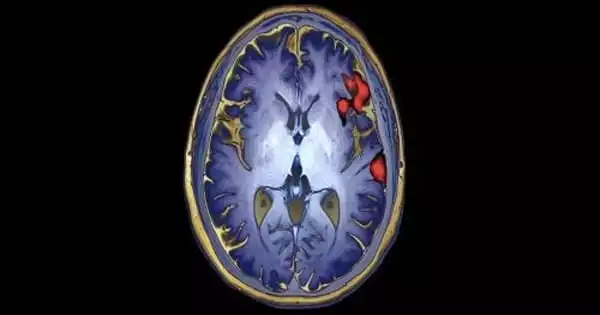
While the brain charts are currently being utilized for study, the team hopes to employ them as a clinical aid in the future. The databases already contain over 165 distinct diagnostic labels, allowing researchers to observe how the brain differs in illnesses such as Alzheimer’s disease.
Alzheimer’s disease involves neurodegeneration and the loss of brain tissue, therefore people with the disease are likely to have a smaller brain volume than their contemporaries. Just as some healthy adults are taller than others, there is variation in brain size; in other words, a little smaller brain does not necessarily imply something is wrong. However, as is apparent from the brain charts, while brain size decreases naturally with age, it does so much faster in Alzheimer’s patients.
Dr. Bethlehem explained: “We’re still at an extremely early stage with our Brain Charts, showing that it is possible to create these tools by bringing together huge datasets. The charts are already beginning to provide interesting insights into brain development, and our ambition is that in future, as we integrate more datasets and refine the charts, they could eventually become part of routine clinical practice.
“Imagine them being used to assist evaluate individuals being screened for illnesses like Alzheimer’s, for example, allowing clinicians to discover signs of neurodegeneration by comparing how quickly a patient’s brain volume has changed compared to their contemporaries.”
Furthermore, the researchers intend to make the brain charts more representative of the entire population, highlighting the need for more brain MRI data on previously under-represented socioeconomic and ethnic groups.
A huge technical feat
Another study co-author, Dr. Jakob Seidlitz of the Lifespan Brain Institute at Children’s Hospital of Philadelphia and the University of Pennsylvania, stated: “Multiple technological accomplishments and a big team of collaborators were required to create these brain charts. Things are a little more complicated when it comes to brain imaging data than just getting out a measuring tape and measuring someone’s height or head size. There were considerable barriers to overcome, including logistical and administrative obstacles, as well as the enormous methodological diversity found in brain imaging datasets.”
The researchers extracted data from MRI scans using standardised neuroimaging software, starting with fundamental qualities like the volume of grey matter or white matter and then on to finer parameters like the thickness of the cortex or the volume of specific parts of the brain. To create their brain charts, they employed a framework developed by the World Health Organization for making growth charts.
Altogether, they estimate that they have used around 2 million hours of computing time, analysing close to a petabyte of data (a petabyte is equivalent to 1,000,000,000,000,000 bytes).
“This would not have been possible without access to Cambridge’s High Performance Computing clusters,” Dr. Seidlitz added. “However, we still consider this a work in progress. It’s the first step toward creating a standardized reference chart for neuroimaging. That is why we created the website and a vast network of colleagues. As fresh data becomes available, we aim to update the charts and improve on these models on a regular basis.”
The team designed the application with a reference structure to allow other researchers and physicians to modify their own datasets and compare them to the BrainChart population.
“The NHS does millions of brain scans every year,” Dr. Bethlehem stated, “and in the majority of these situations, they are examined by radiologists or neurologists relying on their enormous expertise to judge whether there is anything clinically important seen on these scans.” We expect that in the future, clinicians will be able to compare their data to ours and provide a more comprehensive report that includes additional objective and quantitative observations.