Given that hillslopes make up about 90% of the Earth’s surface, chances are excellent that most readers are located on one.
Hillslopes are important landscape elements that carry sediments and nutrients, connect terrestrial and aquatic habitats, and flow water from ridges down to valleys.
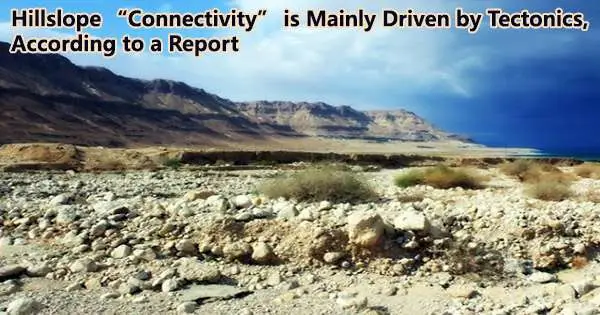
A new large-scale analysis of hillslope connectivity at the continental scale from the University of Kansas was recently published in Geophysical Research Letters. The study contributes to a better understanding of the mechanisms through which hillslopes influence landslides, floods, and the development of wetlands.
“’Connectivity’ describes the likelihood that a part of the landscape is linked to a river,” said lead author Admin Husic, Harold A. and Donna R. Phelps Chair’s Council Assistant Professor of Civil, Environmental & Architectural Engineering at KU. “If you know a certain component of the landscape is highly connected to a river network well then, that part of the landscape could contribute a lot of water as well as other contaminants to the network. In a way, you can identify some source areas you might want to target for management.”
“More basically, ‘connectivity’ describes the movement of water what compartments of a landscape are efficient at moving water as runoff. Some hillslopes readily convey this runoff quickly. Other hillslopes aren’t,” he said.
The study incorporated data from sources like digital-elevation models created by the U.S. Geological Survey, the Global Earthquake Model, the North American Land Data Assimilation System, the Global Landslide Catalog and the Dartmouth Flood Observatory database.
In seeking to determine what factors most influenced connectivity, Husic, along with co-author and recent KU graduate Alexander Michalek, now at the University of Iowa, report “the dominance of tectonic drivers, like river steepness and seismic activity, over climatic drivers, like precipitation and aridity, in controlling the strength of connectivity for the entire continental United States.”
‘Connectivity’ describes the likelihood that a part of the landscape is linked to a river. If you know a certain component of the landscape is highly connected to a river network well then, that part of the landscape could contribute a lot of water as well as other contaminants to the network. In a way, you can identify some source areas you might want to target for management.
Admin Husic
The researchers discovered that whereas low connectivity zones encourage the growth of wetlands, high connectivity zones are linked to an increased tendency for landslides. Further, the researchers worked with the water-science advocacy organization CUAHSI to produce a new open-access digital tool for researchers and the public, called the “Index of Connectivity Mapper.”
“We created these structural connectivity maps for every 10-meter-by-10-meter square grid for the entire United States,” Husic said. “This required use of supercomputers here at KU, because we did this calculation for about 75 billion locations in the United States.”
The researchers wanted the map, which covers the whole continental United States, to be openly accessible to academics, conservationists, legislators, and students rather than “hoard” the data.
“These maps can assist scientists and land managers in their respective domains. An ecologist may want to understand how hillslopes contribute to water and nutrients to a river and how that impacts the aquatic ecosystem,” Husic said. “The index of connectivity is a tool that can be used for that purpose. On the other hand, an agricultural land manager may be interested in finding hotspots of soil erosion or deposition, which is also made possible through investigation of our structural connectivity maps.”
The KU researcher expressed his hope that the digital data gateway may also be used as a teaching tool for students studying environmental engineering or water science, for instance.
“The math behind the maps isn’t necessarily incredibly complex, but it requires collecting and processing raw data sources as well as implementing many lines of code,” Husic said. “So, we sort of did all that for people. It’ll be convenient for students and other researchers to access the calculated outputs and start working with them right away rather than spending time tracking down all the data sources, writing the code, and double-checking that the calculations are correct.”
Although the recent structural connectivity study compares hillslope responses to historical climate conditions rather than those anticipated as a result of human-driven climate change, this understanding will help predict how an area may react to more intense weather events anticipated in the coming decades.
“If we can understand how hillslopes respond to rainfall inputs, we will be better able to predict potential future responses,” he said.
“Here in the Midwest, as climate changes, we anticipate similar amounts of total rainfall, but the rainfall will come down during a shorter timeframe, making events more intense. Looking forward into the future, an important consideration is how the increased intensity of events shifts the amount of rainfall that is absorbed by hillslopes versus how much is transmitted to rivers.”